

Las Angeles County
EpiCenter Summary
There are ongoing investigations to match the most accurate and related information to proven solutions.
.

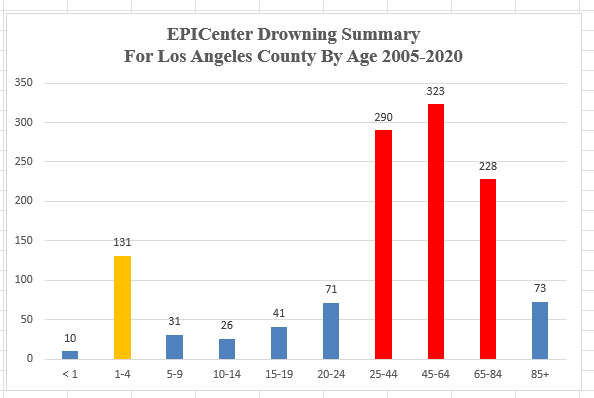
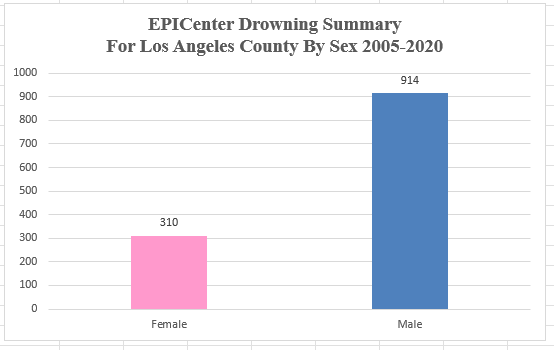
Los Angeles Summary 2005-2020
Injury summary drowning data from 2005 through 2020.
The following information is from a query of the State of California Department of Public Health Online Injury Data System called EPICenter.
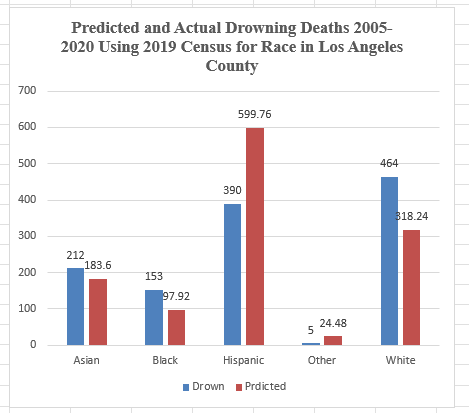
Predicted & Actual Drowning Deaths and ED Visits for Drowning refers to actual reported statistics from the California EpiCenter Online Data reporting tool, and EpiCenter defined grouping: Asian, Black, Hispanic, Other, and White categories by percent of population. EpiCenter data is multiplied by Predicted racial percent and the reported number of drowning deaths or emergency department visits.
2019 US Census Data By Race For Los Angeles County: Asian 15% ,Black 8 %, Hispanic 49% , Other 2%, White 26%
Summary of drowning data for emergency room visits from 2005 through 2015.

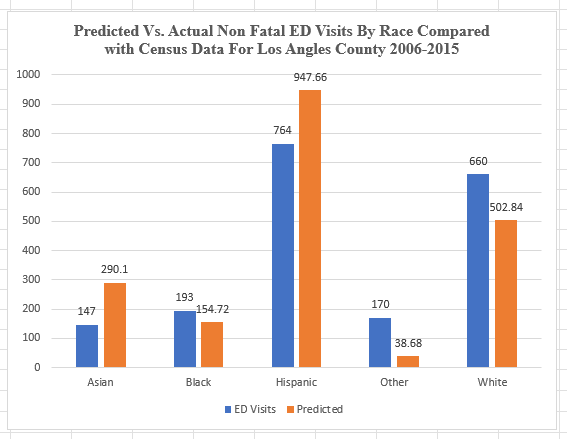
Predicted & Actual Drowning Deaths and ED Visits for Drowning refers to actual reported statistics from the California EpiCenter Online Data reporting tool, and EpiCenter defined grouping: Asian, Black, Hispanic, Other, and White categories by percent of population. EpiCenter data is multiplied by Predicted racial percent and the reported number of drowning deaths or emergency department visits.
